Sometimes you want a small tool that pings your services and yells when something breaks. Uptime Kuma is a neat little self-hosted monitor that does HTTP(s), TCP, ping, and certificate expiration checks. This guide shows two quick ways to run it: Docker (fast and simple) or Kubernetes (if you want it inside your cluster).
Tested with
- Single host or Raspberry Pi
- Docker / Docker Compose, or K3s
- A bit of disk space for the DB (local volume or PVC)
Prerequisites
- A host to run the service (server, VM, or Pi)
- Docker (or docker-compose) OR a Kubernetes cluster (K3s, microk8s, etc.)
- Optional: a persistent volume (so your data survives restarts)
Installation
We will cover two ways to install it, Docker (simpler) and Kubernetes (more complex but also more reliable). Pick the one taht suits you.
Docker (quickest way)
First, create a Docker volume:
docker volume create uptime-kuma
Then run it using this command:
docker run -d --restart=always -p 3001:3001 \
  -v uptime-kuma:/app/data \
  --name uptime-kuma \
  louislam/uptime-kuma:1
The image tag :1 follows the official image. Pin a more specific tag if you want reproducibility.If your user isn’t in the docker group, prefix the command with sudo.Prefer compose? Save this as docker-compose.yml and run docker compose up -d:
version: "3.8"
services:
  uptime-kuma:
    image: louislam/uptime-kuma:1
    restart: unless-stopped
    volumes:
      - uptime-kuma:/app/data
    ports:
      - "3001:3001"

volumes:
  uptime-kuma:
If you already started the container with docker run, stop and remove it before switching to compose:
docker container stop uptime-kuma
docker container rm uptime-kuma
docker compose up -d
Open the UI at http://localhost:3001/setup (or replace localhost with your host IP).
Kubernetes (simple single-node example with K3s)
This uses a Deployment + NodePort. For anything beyond a simple setup, use a PVC instead of hostPath.
Save this as uptime-kuma-deployment.yaml:
apiVersion: apps/v1
kind: Deployment
metadata:
  name: uptime-kuma
  labels:
    app: uptime-kuma
spec:
  replicas: 1
  selector:
    matchLabels:
      app: uptime-kuma
  template:
    metadata:
      labels:
        app: uptime-kuma
    spec:
      containers:
        - name: uptime-kuma
          image: louislam/uptime-kuma:1
          imagePullPolicy: IfNotPresent
          ports:
            - containerPort: 3001
          env:
            - name: DB_TYPE
              value: sqlite
            - name: DB_STORAGE
              value: /app/data/uptime-kuma.db
          volumeMounts:
            - name: uptime-kuma-storage
              mountPath: /app/data
      volumes:
        - name: uptime-kuma-storage
          hostPath:
            path: /data/uptime-kuma
            type: DirectoryOrCreate
And this as uptime-kuma-service-nodeport.yaml:
apiVersion: v1
kind: Service
metadata:
  name: uptime-kuma-nodeport
  labels:
    app: uptime-kuma
spec:
  type: NodePort
  selector:
    app: uptime-kuma
  ports:
    - protocol: TCP
      port: 3001
      targetPort: 3001
      nodePort: 31001
Apply them:
kubectl apply -f uptime-kuma-deployment.yaml
kubectl apply -f uptime-kuma-service-nodeport.yaml
Check it:
kubectl get pods -l app=uptime-kuma
kubectl get svc uptime-kuma-nodeport
Open the UI at:
http://<node_ip>:31001/setup
Web Setup and Monitor Examples
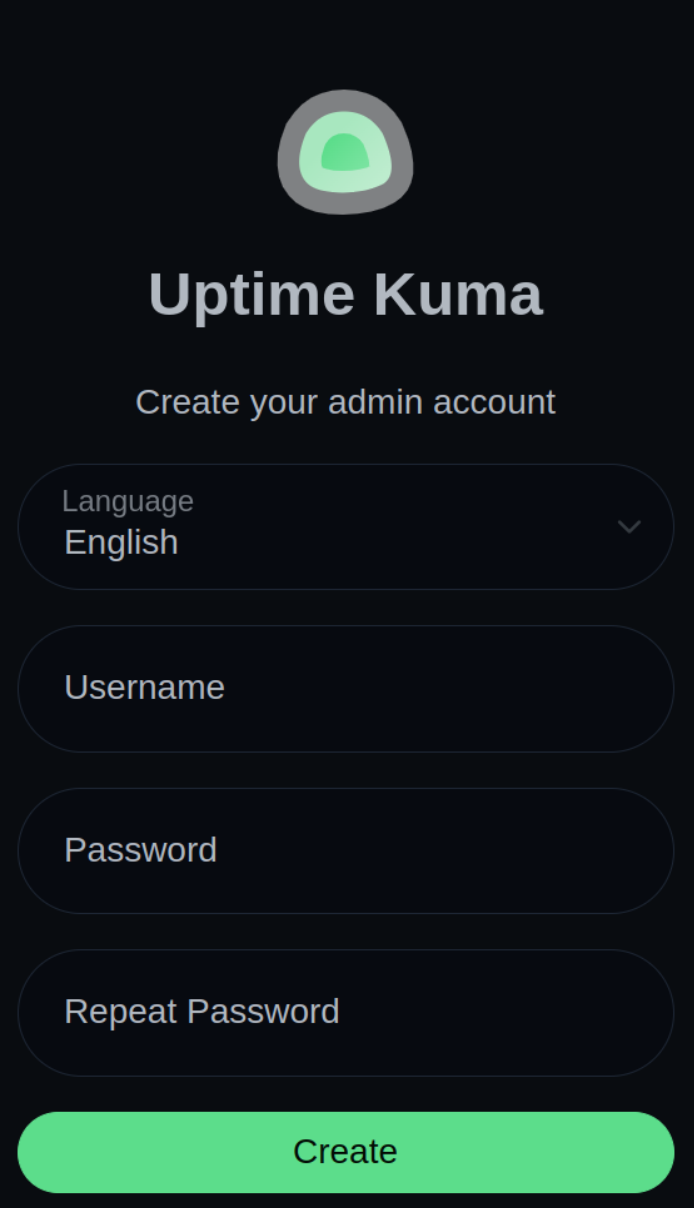
When accessing for the first time, this page will load. Fill it up and click on create.
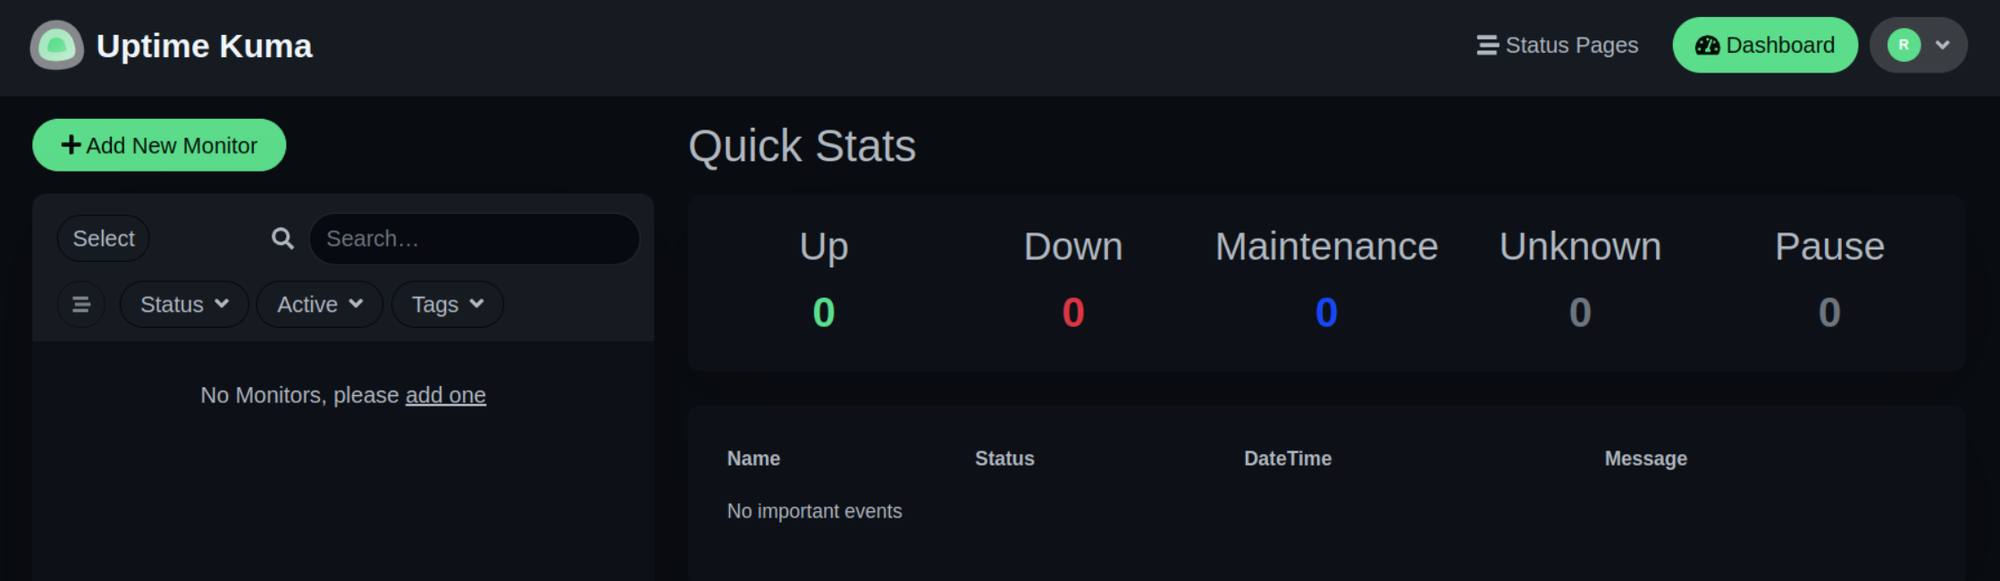
After that, the main page should appear.
Ping Monitor Example
Let's create an example monitor that uses ping. Click on Add New Monitor in the top left corner.
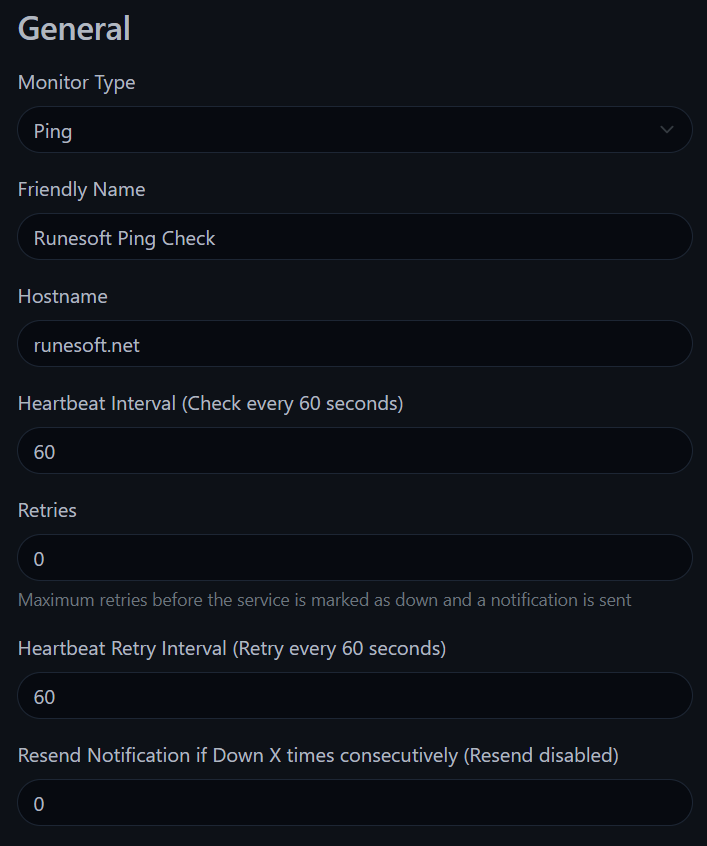
In the example above, I created a ping check as Monitor Type, gave it a friendly name, and the host to check in this case is my own webpage. Use your own data if needed and click on Create.
HTTP(S) Monitor Example
Now let's to create a HTTPS monitor, again click on Add New Monitor in the top left corner.
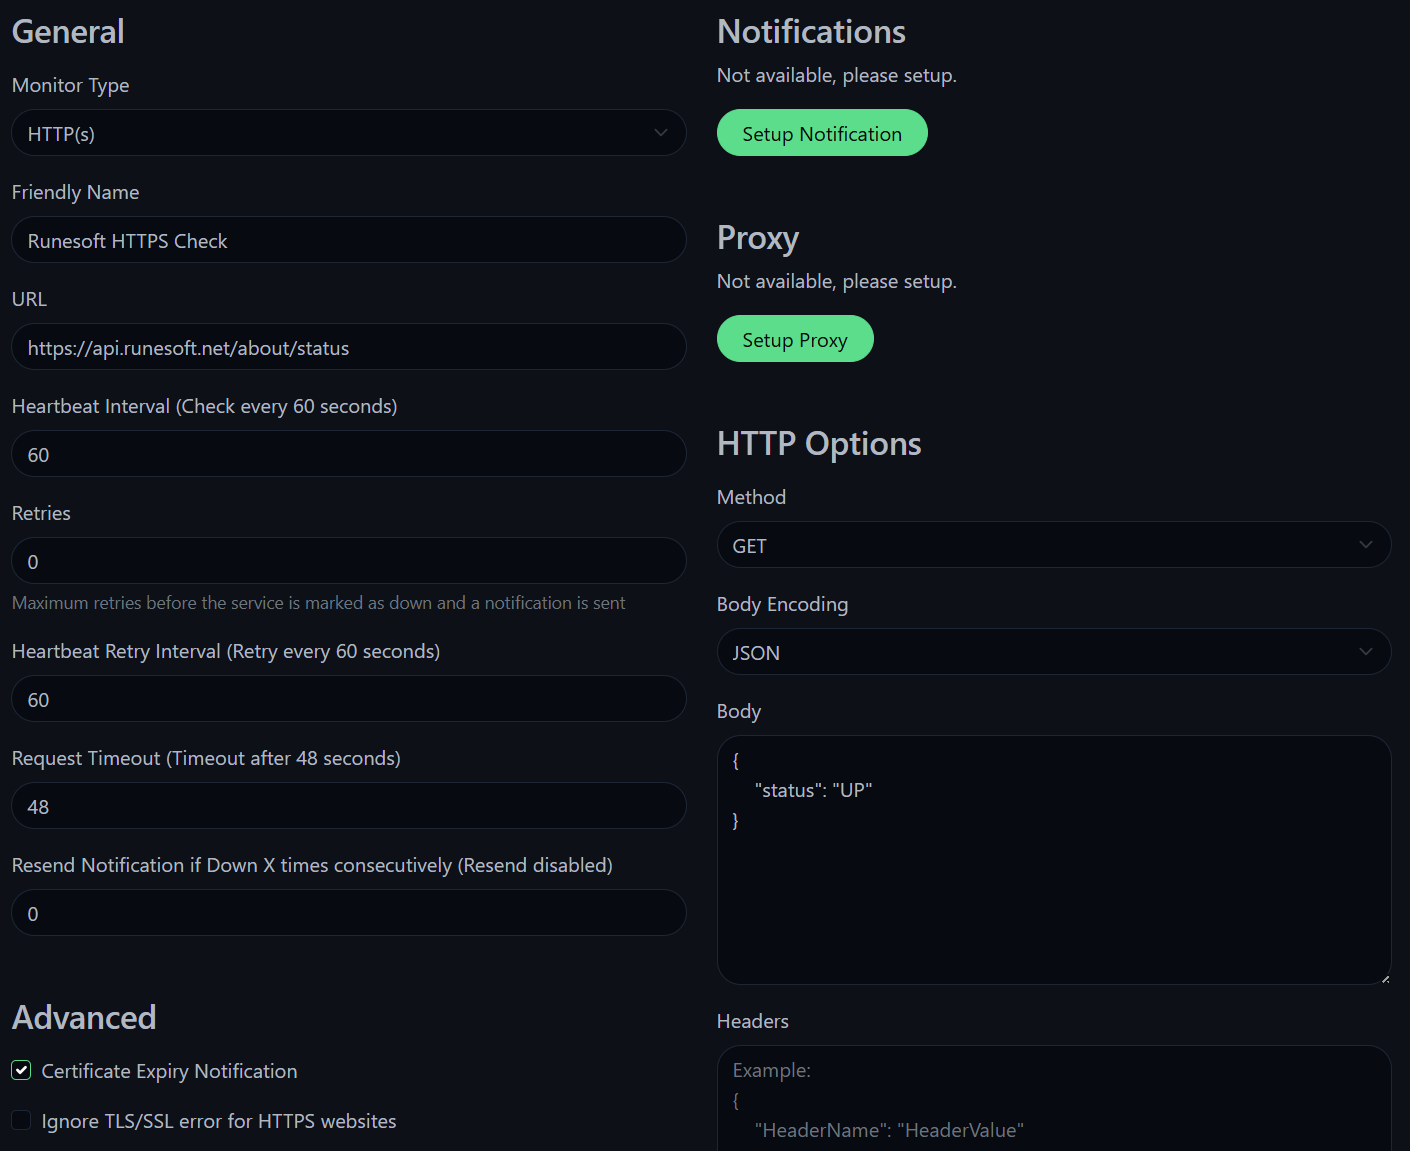
This time, I used my API to test the monitoring. I picked HTTP(S) as Monitor Type, gave it a name, and used https://api.runesoft.net/about/status as the URL. This endpoint already responses with a standarized body message, so I used it to check it on the Body field on the HTTP Options section. Also, I checked the Certificate Expiry Notification box on the Advanced section.
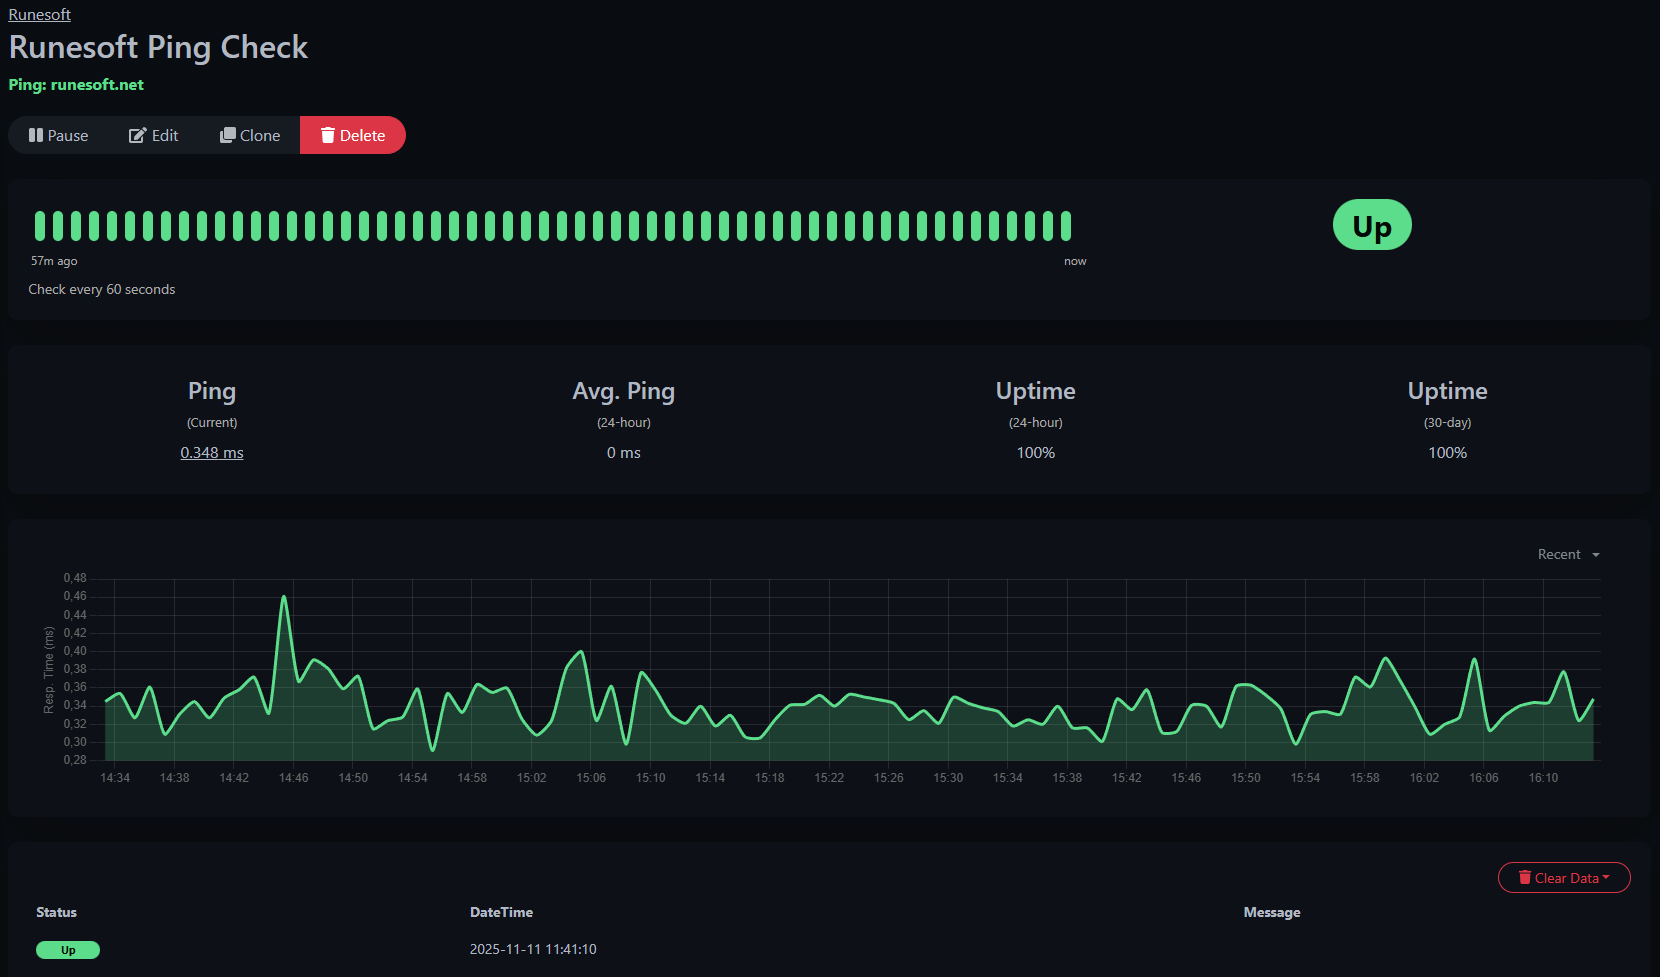
Monitoring status
Finally, as example, when clicking on oen of the monitors (I used the ping one) you will be able to see the status, ping latency, an other information.
Tips and recommendations
- Persistence: In Kubernetes, prefer a PVC + StorageClass over hostPath. hostPath is fine for quick single-node homelabs but isn’t portable.
- TLS: The UI is HTTP by default. If you want HTTPS, put it behind an Ingress (with cert-manager or your reverse proxy).
- Backups: Back up
/app/data/uptime-kuma.dbor the Docker volume regularly. - Resources: Uptime Kuma is lightweight, but if you run it alongside other stuff, add resource requests/limits in the Deployment.
Uninstall / cleanup
Follow this steps if you want to remove Uptime Kuma:
Docker:
docker container stop uptime-kuma
docker container rm uptime-kuma
docker volume rm uptime-kuma   # only if you want to delete the data
Kubernetes:
kubectl delete -f uptime-kuma-service-nodeport.yaml -f uptime-kuma-deployment.yaml
sudo rm -rf /data/uptime-kuma   # only if you used hostPath and want to clear data
Wrap-up
Uptime Kuma is an easy, friendly monitor you can spin up in minutes. Start with Docker if you want the fastest route; move it into Kubernetes with a PVC and an ingress when you want more robustness. Have fun monitoring!